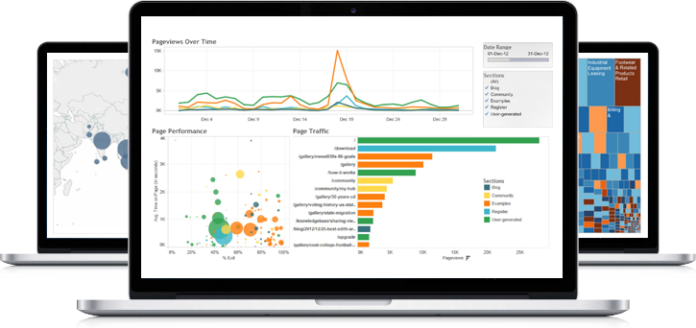
The COVID-19 pandemic has disrupted nearly every aspect of our lives world-wide. To help the individuals, scientists, businesses and governments to score up from the crisis, data analytics proved to show a way. To help people understand their data to make informed decisions, Tableau software has created the ‘COVID-19 Data Hub’.
The Data Hub is a resource for accessing and analyzing the raw data publicized by Johns Hopkins University, the Centers for Disease Control and Prevention (CDC), and the World Health Organization (WHO).
The data provided by these sources can be in multiple formats and hard to understand, “That means, to make it usable for anyone who wanted to review it and see what was happening, it was going to need a lot of data cleansing extract transform and load (ETL) procedures to make it more palatable for the masses”, said Steve Schwartz, Tableau’s director of public affairs.
For instance, the Vatican City and The Holy See were listed as different geographical locations in the John Hopkins, when they are actually same place. This had to be sorted out to ensure accurate data. “The data needs to be standardized so people can work with that data,” Schwartz said.
Thus, the Data Hub evolved as a ready-to-use, cleaned and formatted data, pre-loaded into the starter dashboard to make it easier for people to view and collaborate their data with the John Hopkins data. “The starter dashboard is a simple, austere tool that’s built to allow people and organizations to use or download it so they can use it to bring their own data in for their own analyses”, said Schwartz.
Data-driven decisions in business
“We’re thinking about everything from huge global multinationals to small businesses that are trying to make sense of what this means,” Schwartz says. “You’ve got employees, you have your customers, their supply chains. Every business function, every organizational function is going to have a dimension of it that is going to be touched by this situation.”
The data is helping organizations to understand about their supply chain and how the pandemic has affected them. For governments, data helps them to understand where support programs and policies are most needed. Schwartz says. “They’re using this core data to figure out where to distribute nationally and globally.”
The Data Hub : https://www.tableau.com/covid-19-coronavirus-data-resources
Other data analytics companies providing resources:
Microsoft’s Power BI : https://docs.microsoft.com/en-us/power-bi/create-reports/sample-covid-19-us
Amazon’s AWS: https://dj2taa9i652rf.cloudfront.net/
Apple and Google: https://www.apple.com/newsroom/2020/04/apple-and-google-partner-on-covid-19-contact-tracing-technology/
Qlik: https://community.qlik.com/t5/COVID-19/gp-p/covid-19-group
Domo: https://www.domo.com/covid19/daily-pulse/#overview

